Welcome to the Proof of Usefulness Hackathon spotlight, curated by HackerNoon’s editors to showcase noteworthy tech solutions to real-world problems. Whether you’re a solopreneur, part of an early-stage startup, or a developer building something that truly matters, the Proof of Usefulness Hackathon is your chance to test your product’s utility, get featured on HackerNoon, and compete for $150k+ in prizes. Submit your project to get started!
In this interview, we sit down with Octavian Andrei to discuss My Solar Atlas, a platform designed to help homeowners compare solar quotes without the fear of their data being sold. With a 40.77 Proof of Usefulness score, the tool offers a clear, unbiased lens on solar investments, long-term value, and equipment warranties.
What does My Solar Atlas do?
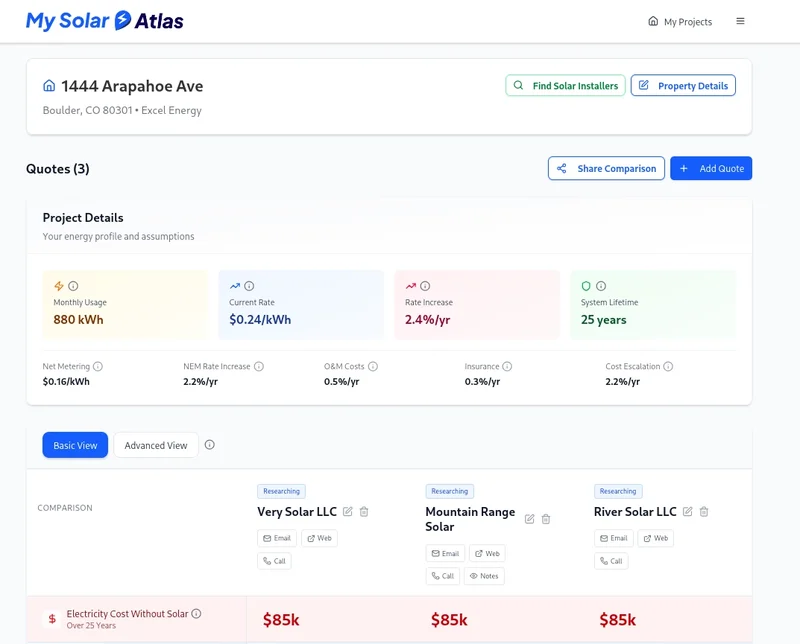
Every big 'quote tool' is driven by generating solar sales. We are not. Here's what you can do on My Solar Atlas without fear of your data being sold or your heartstrings being pulled:
✓ Organize all of your quotes in one place
✓ See estimated benefits with an objective lens on reality
✓ Track warranties, equipment, and long-term value
✓ Decide with confidence
Now’s a good time for My Solar Atlas to exist because homeowners need a secure, unbiased way to navigate the increasingly complex and sales-driven solar market without compromising their privacy.
Who does your My Solar Atlas serve?
Homeowners looking to compare solar quotes can benefit from our web app. It also gives them an idea of the expected returns on investment.
What technologies were used in the making of My Solar Atlas? And why did you choose the ones most essential to your tech stack?
My Solar Atlas was built using React for a dynamic, responsive front-end and Sinch for robust user communications.
What is traction to date for My Solar Atlas? Around the web, who’s been noticing?
Our primary traction has been organic engagement within targeted homeowner communities. Specifically, users in the r/solar subreddit have been noticing our platform through community discussions and helpful resources like our "Solar Shopping Checklist" guide.
My Solar Atlas scored a 40.77 proof of usefulness score (https://proofofusefulness.com/report/my-solar-atlas) - how do you feel about that? Needs reassessment or just right?
With Google having over 900 on their usefulness score, it's hard to gauge what exactly that means. It is not clear why the team chose to input 'unicorn utilities' into their proof of usefulness reports given that these trillion-dollar companies skew the meaning of the score for builders, but maybe there's a reason behind that which we're not familiar with.
What excites you about My Solar Atlas's potential usefulness?
Being able to help homeowners decide if solar is even right for them, and going with the best installer which maximizes their long-term energy production and removes guesswork from expected benefits.
Walk us through your most concrete evidence of usefulness.
The fact that some of our users add over 5 quotes for comparison. Previously, this would have been done in a spreadsheet and required the homeowner to build their own scoring methodology, which takes time and is error-prone.
How do you measure genuine user adoption versus "tourists" who sign up but never return?
From a homeowner perspective, the only way to retain users would be to build an ongoing app that tracks energy production vs. returns. We are still exploring ways to benefit homeowners in the long term.
If we re-score your project in 12 months, which criterion will show the biggest improvement, and what are you doing right now to make that happen?
We are expecting a 10x growth in visitors, a 2-3x increase in our conversion rate (currently hovering around 5% for visitors that convert into users), and we will also be adding a paid plan.
Given your strong real-world utility in helping homeowners compare quotes objectively without selling their data, how do you plan to monetize My Solar Atlas while keeping that core promise intact?
We actively blog on Substack and are building this solution in the open. We will be up front about any changes, and they will always be clear within the web app. For example, if we have sponsored installers down the road, it will read as such.
Meet our sponsors
Bright Data: Bright Data is the leading web data infrastructure company, empowering over 20,000 organizations with ethical, scalable access to real-time public web information. From startups to industry leaders, we deliver the datasets that fuel AI innovation and real-world impact. Ready to unlock the web? Learn more at brightdata.com.
Neo4j: GraphRAG combines retrieval-augmented generation with graph-native context, allowing LLMs to reason over structured relationships instead of just documents. With Neo4j, you can build GraphRAG pipelines that connect your data and surface clearer insights. Learn more.
Storyblok: Storyblok is a headless CMS built for developers who want clean architecture and full control. Structure your content once, connect it anywhere, and keep your front end truly independent. API-first. AI-ready. Framework-agnostic. Future-proof. Start for free.