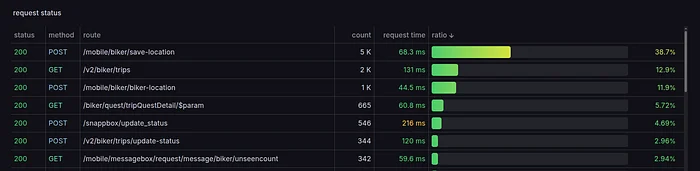
The whole thing started with one plain, annoying question: how do we get real metrics out of nginx?
Nginx sits in front of basically everything we run, terminating connections, proxying requests, doing its job quietly the way nginx always does. And we had almost no idea what it was actually doing at any given moment. Access logs, sure. But access logs are not metrics. You can’t put an access log on a Grafana panel and watch it move. You can grep it after something’s already broken, which is a very different thing from knowing it’s breaking while it happens.
Nginx won’t tell you anything
Turns out nginx does not expose real metrics by default. Stock nginx ships with stub_status, and that's the entire offering:
location = /basic_status {
    stub_status;
}
Four numbers. Active connections, accepts, handled, requests. No per-route latency. No per-status breakdown. Nothing that tells you which endpoint is slow or which one’s throwing 500s at 3am. Want more? Go build a second system that tails and parses the access log, and hope it keeps up with information the proxy already had in memory half a second earlier.
And we met OpenResty, by accident, basically
We weren’t looking for “an nginx alternative.” We were looking for anything that could get Prometheus metrics out of nginx without reinventing the wheel. That search led us to can we even run OpenResty instead of our normal nginx? Same production behavior, same configs, same load, no new class of problem. That doubt was genuine. What settled it:
- Open-source, nothing hidden behind a closed binary
- Tracks upstream nginx releases closely, no frozen fork waiting years on a CVE fix
- A genuinely active community, not a graveyard of five-year-old issues
- Already proven at serious scale at some very large, well-known companies
Once that doubt cleared, OpenResty stopped being a risky swap and started being a legitimate replacement, and the scope of what we wanted from it kept growing well after that first decision.
The first change we made, and why it broke immediately
Since the script had no route label at all, that was the first thing I added. Raw path off ngx.var.request_uri, into log_by_lua_block, shipped as a new label. Worked first try. Felt solved for a day. Then I looked at the actual cardinality in Grafana. “Just add a label” is a sentence that ages badly. Every unique path was becoming its own permanent time series:
/orders/8231
/orders/8232
/orders/8233
...
Multiply that by every user ID, every UUID, every hex token some service decided to shove into a URL, and you don’t have a metrics system, You have a cardinality explosion. The route label needed to become “a shape, not an instance.”
local function is_param_segment(seg)
    if #seg > cfg.sanitize_max_segment_len then
        return true
    end
    if cfg.sanitize_pure_numeric and seg:match("^%d+$") then
        return true
    end
    if cfg.sanitize_uuid and seg:match("^%x%x%x%x%x%x%x%x%-%x%x%x%x%-%x%x%x%x%-%x%x%x%x%-%x%x%x%x%x%x%x%x%x%x%x%x$") then
        return true
    end
    if cfg.sanitize_hex and #seg >= 8 and seg:match("^%x+$") then
        return true
    end
    if cfg.sanitize_slug_suffix_digit and seg:match("-%d+$") then
        return true
    end
    if cfg.sanitize_long_with_digit and #seg > cfg.sanitize_min_len and seg:find("%d") then
        return true
    end
    if cfg.sanitize_file_extension and seg:match("%.%a%a+$") then
        return true
    end
    return false
end
Six checks, one job. Too long → data. Pure digits → data. Real UUID shape → data. Hex-looking token → data. Slug with a trailing number → data. File extension → data. Anything else, it stays. Then the route gets rebuilt, collapsing repeats:
local segments = {}
for seg in path:gmatch("[^/]+") do
    if is_param_segment(seg) then
        if segments[#segments] ~= "$param" then
            table.insert(segments, "$param")
        end
    else
        table.insert(segments, seg)
    end
end
local route = "/" .. table.concat(segments, "/")
/orders/8231/items/9f8a3c2e-... becomes /orders/$param/items/$param. Grouped, meaningful, bounded.
Same problem, different costume
Client IP as a label: same story, one series per client, forever. So the masking depth depends on scope:
local function get_client_subnet(addr)
    if not addr then return "unknown" end
    local ip = addr:match("^%s*([^,]+)"):match("^%s*(.-)%s*$")
    local a, b, c, _ = ip:match("^(%d+)%.(%d+)%.(%d+)%.(%d+)$")
    if not a then return "unknown" end
    a, b, c = tonumber(a), tonumber(b), tonumber(c)
    -- RFC1918 / pod CIDRs: keep /24 for granularity
    if a == 10 or a == 192 or (a == 172 and b >= 16 and b <= 31) then
        return a .. "." .. b .. "." .. c .. ".0"
    end
    -- Public IPs: /16 is enough, avoids high cardinality
    return a .. "." .. b .. ".0.0"
end
Pod CIDRs keep a /24, pods churn constantly, but some locality still beats none. Public IPs get flattened to a /16. More precision there is just noise dressed up as insight.
Host label had the same trap. Any internal IP landing in a Host header meant a fresh series per pod, per service. So $host gets classified instead of passed through raw:
local function classify_host(h)
    if not h then return h end
    local hostpart = h:match("^([^:]+):?%d*$") or h
    if hostpart == "127.0.0.1" or hostpart == "localhost" then
        return "localhost"
    end
    if hostpart:match("^%d+%.%d+%.%d+%.%d+$") then
        if cfg.cluster_ip_prefix and hostpart:sub(1, #cfg.cluster_ip_prefix) == cfg.cluster_ip_prefix then
            return "kubernetes"
        end
        return "$ip"
    end
    if hostpart:match("^[%x:]+$") and hostpart:find(":") then
        return "$ip"
    end
    return h
end
Real domains pass through untouched. Cluster-internal IPs collapse to "kubernetes". Anything else IP-shaped collapses to "$ip". Two buckets instead of one series per pod that ever touched a Host header.
By the third label, the lesson was obvious: every label is a decision, not a free feature. Prometheus multiplies label combinations, it doesn’t add them. Every toggle in the config exists because of this:
label_method            = true,
label_route             = true,
label_status            = true,
label_client_subnet     = false,
label_host              = true,
Why response time as a gauge, not just as a histogram
A histogram doesn’t give you a number. It gives you bucket counts, and histogram_quantile() turns those into an estimate, one that's only as good as the sample size behind it. And here's the thing: not every route carries the same weight. A route hit hundreds of times a second has plenty of samples, a histogram gives you a real, stable p95. A route hit three times in the last five minutes doesn’t. And in real-world per-container sidecar nginx you don’t receive much traffic on a route and if you do, it’s the minority of them all. And the storage cost of those histogram-based metrics explodes your prometheus database for no good reason.
That’s exactly what the gauge fixes. No estimation. It reports the actual duration of the * last* request for that exact label combination. For a quiet route, that’s a far more honest answer than any quantile math on three samples. For a busy route, the gauge is noisier, but that’s fine, the histogram’s already doing the real work there. And still for a noisy route i still suggest gauge because if it’s missed in the first interval, it’d be captured on the next scrape or by other pods on the same interval. hmm? Anyway you can run both, and every route gets the representation it actually has the traffic to support.
Gauges don’t know when to shut up
Counters are self-cleaning, if nothing happens, they don’t move. Gauges aren’t. Set once and never touched again, a gauge just sits there, reporting a stale value with total confidence forever. And given what we just covered, the quiet routes most likely to go stale are exactly the ones we built the gauge for in the first place.
local function reset_expired_metrics(premature)
    if premature then return end
    local now = ngx.now()
    for _, key in ipairs(latency_dict:get_keys(cfg.expiry_scan_limit)) do
        local entry = latency_dict:get(key)
        if not entry then goto continue end
        local last_update, metric_type = entry:match("^([^|]+)|(.+)$")
        last_update = tonumber(last_update)
        if last_update and now - last_update > cfg.expiry_window then
            -- ... rebuild labels from the key, zero the matching gauges, delete the key
            latency_dict:delete(key)
        end
        ::continue::
    end
    ngx.timer.at(5, reset_expired_metrics)
end
ngx.timer.at(5, reset_expired_metrics)
A shared dict, timestamped per label combo, swept every 5 seconds. Anything silent past the window gets zeroed and dropped. expiry_scan_limit bounds the scan on purpose, unbounded under high cardinality would freeze every worker at once.
And yes, I found a real bug in my own version of this while writing this up. The expiry marker was only written inside one metric’s if block, so if that one metric was off, the others sharing its scope never expired at all, no matter how stale. Fixed: one marker per scope, written once, regardless of which metrics are enabled:
if metric_latency or metric_request_size or metric_response_size then
    ngx.shared.custom_metrics:set("req|" .. table.concat(labels, "|"), ngx.now() .. "|req")
end
By this point, the original problem was solved. Nginx went from telling us almost nothing to an OpenResty sidecar exposing method, route, status, latency as both gauge and histogram, request size, response size, connection metrics, all labeled, all bounded, all self-cleaning. That was the whole original ask. What comes next isn’t a continuation. It’s a separate story that happened to reuse the same piece of infrastructure.
How we ended up watching outgoing traffic too
Everything so far only ever looked at requests coming in. Reverse-proxy territory. But our apps also make calls out, to other services, to third-party APIs, and on that side we had nothing. No logs, no metrics, no visibility. If an app started hammering an external API too hard, or a call started silently timing out, we’d find out the way you always find out about things you don’t monitor: after it’s already caused a problem. So the question this time was fresh: how do we get any visibility into traffic leaving our pods, without asking every team to touch their code?
That’s what pointed us straight back at the sidecar we already had. Already patched, already trusted, already deployed everywhere. A new piece of infrastructure just for egress would’ve meant a second sidecar, a second image, a second thing to reason about per pod. Reusing what was already there meant no new moving part. Just a second job for something that already existed.
The cost of doing this
Before extending the sidecar, the obvious question was whether it was even worth it, whether we were about to trade one problem for a heavier one. The resource math settled that fast.
OpenResty sits at somewhere around 10–20MB of RAM and close to zero CPU under real production load, nothing compared to what the actual apps sitting next to it are using. Metric generation happens in log_by_lua_block, which runs after the response has already been sent, so it never blocks or delays a single request waiting on Lua to finish counting things. And since the sidecar lives in the same pod, the extra network hop for outbound traffic is loopback, not a real hop at all, close enough to free to not show up anywhere in latency numbers.
There’s one more thing this setup gives us almost for free: it isn’t limited to east-west, in-cluster traffic. Since the forward proxy sits directly in the egress path of the pod itself, it sees north-south traffic too, every call actually leaving Kubernetes toward a third-party API or anything else outside the cluster, not just service-to-service hops that stay inside it. If it left the pod, we see it.
Making it cost the app team nothing
Whatever we built couldn’t turn into a task for every app team. No code changes, no SDK, no “please wrap your HTTP client.” So the fix had to live entirely in infrastructure the app teams already didn’t have to think about: the sidecar. And the mechanism that makes that possible is old and boring in the best way, HTTP_PROXY/HTTPS_PROXY, environment variables every serious HTTP client already respects natively. Point a proxy at those, and the client routes through it automatically. No code change, no library, no per-language anything.
What we are talking about right now is actually called a “Forward Proxy”
Stock OpenResty doesn’t support HTTP CONNECT out of the box, which is what tunneling HTTPS through a proxy needs. So the image gets patched at build time. Clone the
docker build \
  --build-arg RESTY_VERSION="1.27.1.2" \
  --build-arg RESTY_ADD_PACKAGE_BUILDDEPS="git patch" \
  --build-arg RESTY_EVAL_PRE_CONFIGURE="cd /tmp && git clone https://github.com/chobits/ngx_http_proxy_connect_module.git" \
  --build-arg RESTY_CONFIG_OPTIONS_MORE="--add-module=/tmp/ngx_http_proxy_connect_module" \
  --build-arg RESTY_EVAL_PRE_MAKE="cd /tmp/openresty-1.27.1.2 && patch -d build/nginx-1.27.1 -p1 < /tmp/ngx_http_proxy_connect_module/patch/proxy_connect_rewrite_102101.patch" \
  -f alpine/Dockerfile \
  -t registry.company.com/devops/docker-openresty/openresty:1.27.1.2-egress-0.1 \
  .
Clones the module, patches it against the exact nginx core bundled in that release, compiles it in. The patch filename has to match the core version, every bump means re-checking the module’s patch/ directory first, a mismatch just fails silently. Then a second server block, bound only to loopback:
server {
    listen                        127.0.0.1:3128;
    resolver                      10.233.0.3 valid=10s;
    resolver_timeout              5s;
    proxy_connect;
    proxy_connect_allow            443;   # restrict CONNECT to HTTPS only
    proxy_connect_connect_timeout  10s;
    proxy_connect_read_timeout     10s;
    proxy_connect_send_timeout     10s;
    access_log                     /dev/stdout egress_log;
    location / {
        proxy_pass                http://$http_host$request_uri;
        proxy_set_header          Host $http_host;
        access_log                /dev/stdout egress_log;
    }
}
Loopback-only, never reachable from outside the pod. proxy_connect_allow 443 keeps CONNECT restricted to HTTPS on purpose, this isn't meant to tunnel arbitrary TCP. resolver needs the real CoreDNS ClusterIP, fetched per cluster since it's not portable:
sudo kubectl get svc -n kube-system -l k8s-app=kube-dns -o jsonpath='{.spec.clusterIP}'
And validated before it ever ships:
sudo docker run --rm -v $(pwd)/egress.conf:/etc/nginx/conf.d/egress.conf:ro \
  registry.company.com/devops/docker-openresty/openresty:1.27.1.2-egress-0.1 \
  sh -c "openresty -t"
The entire app-side integration
This is the part that made the whole thing viable to roll out broadly. The entire integration on the application container is this:
env:
  - name: HTTP_PROXY
    value: "http://127.0.0.1:3128"
  - name: HTTPS_PROXY
    value: "http://127.0.0.1:3128"
  - name: NO_PROXY
    value: "localhost,127.0.0.1,.svc.cluster.local,.company.com"
That’s it. NO_PROXY matters just as much, without it, purely internal calls route through the proxy unnecessarily. No SDK, no wrapper, no per-language change. Every outbound call now transparently passes through the sidecar, and the app has no idea it happened.
Why HTTPS only gets host:port
HTTP gets logged in full, method, host, path, status, timing. HTTPS gets logged only as CONNECT host:port, because TLS stays end-to-end encrypted. Real HTTPS visibility would mean terminating and re-establishing TLS ourselves, running our own MITM, which is a far heavier decision around certificate trust and security surface. Not something I'm introducing as a side effect of a metrics project. Stays out of scope, deliberately.
Limitations we accepted going in:
- Route and method are obsolete here, since they live inside the encrypted tunnel; the rest survive
resolverhard-depends on the CoreDNS ClusterIP, if it changes, outbound proxying breaks silently until the config's updated, worth its own health check- The patch is version-pinned, every bump means re-verifying compatibility before rebuilding
Telling incoming and outgoing apart
One thing was still missing once both directions flowed through the same pipeline: a clean way to tell which direction a data point represented, without relying on someone remembering which panel means what. One more label: mode, set once per server block.
server {
  listen 80;
  location / {
    set $request_mode 0;   # reverse-proxy / incoming
    fastcgi_pass  127.0.0.1:9000;
    fastcgi_param SCRIPT_FILENAME /var/www/html/index.php;
    include       fastcgi_params;
  }
}
server {
    listen 127.0.0.1:3128;
    location / {
        set $request_mode 1;   # forward-proxy / outgoing
        proxy_pass http://$http_host$request_uri;
        proxy_set_header Host $http_host;
    }
}
local mode = cfg.label_mode and (ngx.var.request_mode or "0") or nil
local labels = build_labels(method, route, status, client_subnet, host, mode)
Decided once at the routing level, read once by Lua, no inference needed. Two values, cardinality cost is basically nothing. One Grafana query now splits traffic by direction, instead of two dashboards or someone’s memory doing that job.
Somewhere along the way, this quietly stopped being “a fix for one app”
Nobody decided to build a company-wide standard. It started as an answer to one narrow question, for one service. But once the sidecar existed in a toggle-driven form, extending it to the next one was almost trivial: copy the ConfigMap, flip a few toggles, done. Shrinking it for a low-traffic service was the same operation in reverse. So it spread. Not through a mandate, just because it was already the easiest answer every time the same question came up. At this point it sits in front of most of what we run, doing both jobs at once.
Nobody on the team knew Lua before this. It stayed contained, people extend it by copying a block, not by learning the language. That was never the goal. The goal was making the proxy layer legible without turning everyone into an nginx-internals specialist.
One side effect I didn’t plan for at all: once the metrics were actually good, the access logs stopped earning their keep. We turned them off. We quietly stopped shipping a stream of raw access logs into Elasticsearch, a stream that had been costing real storage and indexing overhead to answer questions already sitting in Prometheus, queryable, labeled, instant.
If you want to see the whole thing
I keep a working sample and the full script up rather than just describing it, at
Where all of this actually leaves us
- One question, why doesn’t nginx expose real metrics, not a grand redesign
- Discovered OpenResty existed at all through knyar/nginx-lua-prometheus , credit where it’s due
- A route label that didn’t exist in the original script, our first change, and our first lesson in cardinality the hard way
- Every metric and label individually toggleable, by design, from day one
- A route sanitizer doing real, layered classification, not a single regex
- Scope-aware IP masking, a host label collapsed into two bounded buckets
- Response time as both gauge and histogram, because not every route carries the same weight
- Gauge expiry that actually covers every gauge, after fixing a real bug where it silently didn’t
- A separate story about outbound traffic, kept apart on purpose, including a service mesh we chose not to bring in
- A forward proxy on the same sidecar, patched module, outbound visibility for the cost of three env vars
- HTTPS staying properly opaque, on purpose
- One small
modelabel tying both directions together - A fix for one app that grew into a standard sidecar in front of most of what we run
- Access logs turned off, and an Elasticsearch bill we don’t pay anymore
- The full script, a working sample, and a real dashboard, kept in the open, not just described
Nginx used to sit there quietly, doing exactly what it’s told and volunteering nothing else. For us that became the whole problem. So we didn’t replace it. We taught it to talk. One label at a time, one bug at a time, until the black box turned into something that just tells us what it’s doing.
It’s still nginx under all of it. It just finally learned to talk back.
Links
- knyar/nginx-lua-prometheus — the repo that got us here in the first place
- chobits/ngx_http_proxy_connect_module — the patch that gives OpenResty CONNECT support
- Full Lua exporter + sample config
- Sample Grafana dashboard