The TL;DR
Online simulation: https://nathanbos.github.io/power-sim/
Github repo including simulation guide:
TL;DR spoiler: You can get more statistical power out of a limited subject pool by using a within-subject design (each person does multiple conditions), have each person do multiple tasks/ problems per condition, and treat outcomes as semi-independent data points with a crossed statistical correction to account for the dependency. The simulation helps you estimate how well this will work.
Power analysis: why nobody wants to invite the statistician to the party
The person who does the power analysis is the guest nobody wants to invite to the party, but everyone knows you should. I was this bearer of bad news more than a decade ago for a multimillion-dollar government research program, which I will call Program Impossible. The program wanted a large, well-controlled evaluation with large groups, multiple nested conditions, and be able to detect small differences between them. Doing this with a traditional between-subjects design made the power requirements (number of subjects needed) explode. Ten person groups meant that every 10 people counted as N=1, and many of these groups would simply be controls for the conditions we actually wanted to study. The complex design required many comparisons, and small effect size meant each was difficult to detect with any certainty. The program went in expecting to need hundreds of subjects but, if nothing changed, their power requirements was many thousands, a completely infeasible number.
It doesn’t take a complex group study design to make your statistician into the party’s pariah. Even simple designs are daunting if you are honest about requirements. In my current work, I am studying what happens when you take a traditional graphical user interface (GUI) and give the user an LLM powered chat guide along with it. I might like to set up a simple A/B test, with A being ‘GUI only’ and B being ‘GUI + Guide’. In planning the A/B study I would use a power analysis to ask the question, “how many participants do I need?” Or, more precisely, “If there is a ‘medium’ size difference between these conditions, how many participants to I need to have an 80% chance of detecting this difference?”
I open the R pwr package and input this:
pwr.t.test(d = 0.5, sig.level = 0.05, power = 0.8, type = “two.sample”)
And get back: n = 63.76561
That means 63 people per condition. I need 126 total people to test whether my GUI guide is an improvement. For a small design study, 126 is often an impossibly high number, both in terms of recruiting and running that many sessions.
What are my options?
- Run with however many people I can get and hope I have I either have a very large effect size, or just get lucky.
- Design the study for discovery not hypothesis testing, so that I do not need that level control. (See Landauer and Nielsen, 1993, and many follow-up studies on power analysis for usability testing.)
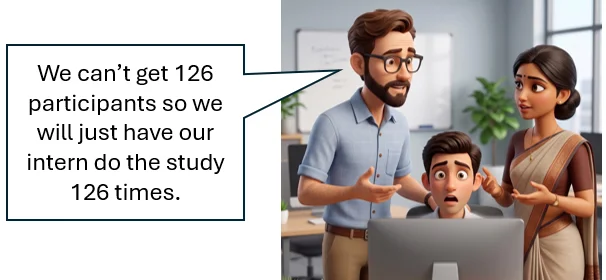
- Ask our intern to run the task 126 times. Ha, ha. But we can’t do that. Can we?
This last option was the line of thought our team took in Program Impossible. Could we just have a smaller number of teams each do more problems? If, for example. 100 teams did 25 problems each, that gives us 2,500 data points instead of 100, closer to feasible. Is that legitimate?
As stated, no, it is not. We would have violated the statistical assumption that the data points are independent of each other; groups of responses all came from the same team. A more traditional approach is to have each team do multiple problems but average them into one score, but for power purpose that puts us right back to N=100.
But what if, instead of averaging scores across problems, we treat the points as semi-independent, and use multilevel regression to control for the dependency? Could that work?
That can’t be right! Between-subjects designs do not work.
My team quickly ran into two problems. One was the mathematics of between-subjects experiments. The second was a stubborn task lead, namely me, who did not want to believe the initial results.
My team member did a mathematical analysis showing that additional questions added very little in a between-subjects design, as shown in Table 1. This table shows observed statistical power (percentage of runs where a difference was detected) for N participants by M problems. I did not want to believe this outcome when I saw it. Intuitively, it seemed wrong. How could we have that much more data but not gain more information?
So, we built analysis #2, a small Monte Carlo simulation, which is slower but more transparent. This is how the current simulation works; it generated synthetic populations of participants and problems, adds an ‘effect’ and some noise, tests whether the effect is statistically detectable a number of times and reports how many times this ‘true’ effect was found, with 80% being the target goal by convention.
Both analyses said exactly the same thing. If we used a between-subjects design, meaning each person is in only one condition, we gain little or no information about the test by adding questions and analyzing them independently. The idea was a bust.
What is going on? Why doesn’t more data give more information? In a between-subjects design, Group A and Group B are made up of entirely different people. That introduces irreducible human noise—baseline individual differences. With small numbers of participants and a between-subjects design we cannot eliminate the possibility that Group B might just happen to have inherently faster, smarter, or more tired participants than Group A, and adding more questions cannot resolve that. More questions does give you more information, which could help you make an increasingly better estimate of subject ability and question difficulty, but does not tell you anything more about the conditions.
Within-subject design saves the day.
It is a Program Impossible kickoff meeting a year later, and the performers (the teams whose product we would evaluate) are lined up across the room waiting their turn at the microphone to tell us how problematic the T&E plan was. The powers-that-be has decided not to address the power problem, along with a number of other potential problems. I was asked to sit on stage representing our team, tacitly supporting a T&E plan that we thought had fatal flaws. I did as I was asked. Then we went back home, and I asked my team to work on the power simulation some more.
We took a new tack: what if we crossed conditions? In a within-subjects design, each participant does multiple conditions. Because you are comparing a person’s performance in Condition A directly to their own performance in Condition B, that baseline “Human Noise” cancels out.
Using a within-subjects design, our simulation showed the results I wanted to see: adding problems and treating the answers as semi-independent added statistical power. You can see this clearly in table 2 output, run with the simulation default settings. In the column for N=32, for example, at the top of the table we see an inadequately powered ‘red’ number, 12.5%, whereas going down the column by adding problems we achieve statistical ‘green light’ numbers at M=16. The table also shows diminishing returns, a second important finding.
Success! We found a way, at least theoretically, to use more problems to get more statistical power from the same size participant pool, and have a simulator that can give us estimates of exactly how many participants and problems we need.
How the simulation works, with different types of variability
As noted, this is a Monte Carlo simulation. The percentages are not estimates, they are observations of how many times in each cell we detected a statistically significant difference between the conditions. (Use the Simulation Runs tab to see the actual runs.)
Some more details:
Human Variability
Humans have different abilities, personalities, experiences, etc. which affect experimental outcomes, so in order to make a claim about how different conditions affects humans, we need to test with many humans. Our simulated participants are simple folk, represented by one number, participant_ability, generated with a random normal function. Generating 128 simulated people is simple in R: subj_ability = rnorm(128).
Problem Variability
Problems also vary in difficulty, and in the sim these are also modeled with a single number. Generating 64 problems is this same simple code: item_diff = rnorm(64). These are drawn from a standard normal distribution; that distribution has a mean of 0 and a standard deviation of 1, there is (hopefully) some variation with each random draw.
Adding simulated ‘true’ effects
To simulate participants doing problems in two conditions with effect size of 0.5 (medium), we simply add together the participant’s ability to the problem’s difficulty, then add 0.5 to each condition B score while leaving A alone.
There are some additional sources of variability that you can model.
Measurement Error
No experimental task or problem is a perfectly consistent metric. We model this as reliability number, with a default of 0.70, A reliability level of 0.7 is considered ‘good’ for most tests.
Participant by Condition variability. Participants can respond differently to conditions in ways that go beyond their ability. To set this subject by condition variability change ‘Subject baseline SD’. The default is 0.25, half of a medium effect size.
Problem by Condition variability. Problems can also interact with condition in unexpected ways, modeled by Item baseline SD. I generally treat this as a lesser concern because the experimenter has more control over problem difficulty, so defaulted it to 0.
Choosing an effect sizes
What effect size should you model? Effect size asks the question, ‘how big of a difference is there between condition?’ and is measured in standard deviation, so an effect size of 1 is one s.d. of distance between means. The classic text to know is Jacob Cohen’s ‘Statistical power analysis for the behavioral sciences’. That book, along with the pwr package mentioned earlier, are my go-to resources. Effect size has a huge impact on your power, see screenshots below but how can you estimate what it is going to be before you run the study? Cohen reviewed a number of prior studies in the behavioral sciences and recommended that for a simple means test, 0.2 is a small, hard-to-detect effect, 0.5 is medium, and 0.8 is large. One way to make this estimate is to find a similar study that had results you expect and use the effect size observed there. I default to ‘medium’, unless I am studying something where I think the effects will be particularly large, or small.
‘Small’ and ‘Large’ effect size for contrast, default PIPS settings
Some considerations and assumptions
“All models are wrong, but some are useful.” – George Box
I will briefly address two main objections to doing power analysis this way related to our reckless treatment of each problem as independent data points, and devil-may-care use of within-subject studies.
Are all those tasks really independent?
This model works by treating each problem outcomes as semi-independent, with statistical controls for multiple response coming from the same participant. (The more traditional alternative is averaging results together and treating them as a single number, with less variance.) I stand by this as a legitimate statistical method, but in real life it is hard to come up with a large number of experimental tasks that are truly independent of each other. For my GUI + Guide study (if I ever run it), I can come up with a range of tasks, but 128 truly independent tasks is probably unrealistic.
When you see a study (pay close attention especially to LLM benchmark studies) that claim to have thousands of problems, read the fine print. It is easy to come up with a few problems and get an LLM to create more following a pattern, but treating those as independent data points is not statistically honest.
Additionally, for experiments with real humans, the time demands of many problems become unrealistic. My advice:
A) Plan to spend a lot of time developing truly diverse tasks. LLMs can help, but prompt for diversity and commit to spending human time and revision cycles on this. Use the time you saved recruiting more subjects to develop better tasks.
B) Be realistic about how many tasks you can really include.
C) If you have clusters of problems that are quite similar to each other, treat them as subscales, modify the simulation to take account of that with another layer of statistical nesting.
Won’t crossing conditions contaminate the study?
Within-subject design means that participants are doing work in multiple conditions, and there is no way to completely prevent their experiences in one condition from influencing the other(s). Counterbalancing the order of presentation is a necessary but not always sufficient statistical control. You can also model the order of presentation by adding a simple integer variable ‘order’ to the equation. Or you could do a more sophisticated model of human learning and include an Ebbinghaus-style learning curve as a control. But even with these controls, learning effects are hard to fully account for.
I used to avoid within-subjects designs to avoid these uncontrollable effects, but I have become much more accepting of them over time. Within-subjects designs add complexity, but of a type that is realistic and important, and observing learning effects between conditions can be very useful information on its own. There is much more to say about this, but my main advice is to think through every uncontrolled effect that concerns you and think about what you might learn from each case. For my GUI Guide study: maybe learning effects will be so strong that being exposed to the Guide will drastically change how participants use the GUI in the no-Guide condition, thus allowing condition B to contaminate condition A. That seems unlikely, but if it happened I would be able to observe what ‘Guide’ strategies are applied in the ‘GUI’ condition to make such a large difference. Finding strategies which make that big of a difference would become the headline finding, probably more important than the condition difference I was looking for.
A more likely outcome is that the learning effects are small and cumulative with a lot of variability. This does add uncertainty to the statistics but also gives you a laboratory to better understand strategies, patterns of usage, etc. In a within-subject study you can also ask participants to compare the two conditions, which you cannot do in a between-subjects design.
These complexities would not be worth the tradeoff in a medical clinical trial or other high-stake settings, but in applied research, within-subjects designs often give as much in statistical power and interpretability as they take away in control.
Let’s bring back that simulation!
Program Impossible did not ultimately right the ship. That never-to-be-completed evaluation rests at the bottom of the void where big ambitions drown in real-world complexity. Our ideas for expanding power also went down with the ship and the power simulation was never published. The original code and analysis exist on a backup tape somewhere that I cannot access and comprises IP that I do not own. I have, however, applied insights from it many times in the intervening years. And now… it is time to bring it back from the void.
Fourth of July weekend, 2026. Over the course of a weekend a team consisting of myself, Claude Code and Gemini 3 Pro recreate and extends our beautiful little sim, now called Project Impossible Power Simulation (PIPS).
This version is even better. You can include varying assumptions about independence, variability and relative importance of subject and items. The documentation explains how to tune it with pilot data or a comparable study by taking parameters directly from a linear mixed effects analysis on your data with R’s lme4.
PIPS can run via a browser with no installations, via the magic of Github Pages. On Gemini’s recommendation, the sim now uses Clark’s min F’ (quasi-F statistic) to approximate the linear mixed models, which would be harder to do in a browser, see the documentation for details.
How should you use PIPS?
Use it as an ‘intuition pump’
Building and using this simulation the first time greatly improved my intuition about how statistical power, participants, tasks, and study designs interact. I hope that PIPS can do the same for other people. PIPS includes a view where you can look at individual runs, which is not statistically necessary but I find it helpful for understanding variability and the differences between model runs.
Use it for power analysis
You can PIPS for your own power analysis, with some caveats. We never got as far as publishing it, so there is no peer-review or validation study. There are some strong assumptions, so make sure you think through how it applies to your use cases. This is much easier to do than it used to be. First read the documentation for yourself, then point your favorite LLM at the repo and ‘chat’ with it to discuss your questions and reservations.
Extend PIPS it to fit your study
Real studies always have novel complexities. PIPS is open source, released with an Apache 2.0 license, so you can extend it to fit your needs. You and your favorite code assistant should be able to clone the repo and modify PIPS to make your version even better. You might modify it to:
- Simulate more conditions, and more complex designs.
- Add true multilevel analysis (I recommend R’s lme4) instead of the f-test approximation.
- Add an option for a one-tailed test.
- Model tasks that come in type clusters, requiring additional nesting layers.
Now that you have the back story and the recipe, if you find it useful please drop me a note. [email protected]
References
Cohen, J. (2013). Statistical power analysis for the behavioral sciences. Routledge.
Nielsen, J., & Landauer, T. K. (1993, May). A mathematical model of the finding of usability problems. In Proceedings of the INTERACT’93 and CHI’93 conference on Human factors in computing systems (pp. 206-213).
Acknowledgements
Jonathon Kopecky did most of the coding for the original simulation, and is an even better statistical collaborator that Gemini, albeit less available at 3AM. Isaiah Harbison did the first simulation that I did not believe and contributed in many other ways. Rebecca Rhodes offered cogent insights throughout. The author is solely responsible for any errors or omissions.