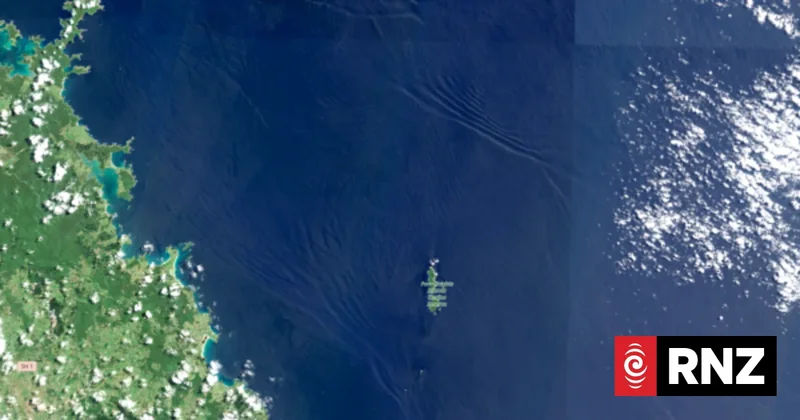
Earth Sciences NZ has been using new satellite data to track how coastal areas of New Zealand are changing in the face of climate change.
Matt Pinkerton, marine ecologist and principal scientist at Earth Sciences NZ, told Nine to Noon one problem with the data previously used was that its resolution started to fail in some areas.
"So in the sounds and in some of the fjords and some of the small harbours we kind of lose data close in to the coast which is just where we're really interested in what's going on."
Using satellites to monitor for coastal change
But he said they had tapped into new satellite data coming in from the European Space Agency.
"So we've got four areas and we've got the high resolution data that gets down to 50 metres in these kind of coastline environments, we can really get close in to the coast."
That was being used to look at changes in the colour of the water near the shore to find out how the sediments and phytoplankton had been changing, he said.
A collaboration with the Plymouth Marine Laboratory in the UK came about due to a recognition that high resolution satellite data that it was using would potentially be useful in New Zealand and a joint project was set up, he said.
"So they had a satellite product and they generated those for New Zealand and we analysed those comparing them with the lower resolution data that we've been using here for some time."
New Zealand was in an area of the world which seemed to be warming very quickly, for example there was a lot of warming in the south-west Pacific and in the Tasman Sea which was pushing into the New Zealand coast, he said.
They wanted to look at the combined effect of how marine systems in those coastal environments responded to warming, as well as the effects of land-use changes including sediments and nutrients coming down the rivers, he said.
"So we're seeing around the North Island in particular decreasing amounts of ocean productivity close in to the shore, around the South Island tends to be increasing amounts of productivity, but it's very localised as well, so one of the uses of this data is to try and look in the different estauries and look at which ones are being affected more and less by sedimentation and by these changes of temperature on the phytoplankton to try and prioritise what we can do about it."
New Zealand had a huge coastline and it was difficult to monitor it solely through use of things like water samples which only provided a limited amount of information, he said.
"So the satellite data really gives us an overview, an overall picture, about what's happening around the whole coast."
That made it possible to prioritise particular areas that needed attention, he said.
"And if we decide to do an intervention in a particular area we want to be able to monitor what effect that is having, if it's being effective or not."
The satellite data enabled them to hone in on particular areas, he said.
"This satellite data is giving us the ability to say this area looks like it's got more a problem, it's changing like this, it's maybe changing in particular months in response to particular weather patterns, so we can really kind of home in to where we need to put the effort into understanding what's going on."
The satellite images should also allow them to put better instrumentation in place in areas that need to be monitored, he said.