In another 39 bigger cities, condo prices fell by 8% to 14%. A massive hangover after a historic Condo Bubble.
Condos have, let’s say, some issues after the breath-taking price explosions from mid-2020 to mid-2022 of 50%, 60%, or even 70% in some cities. In the 10 years to the peak, prices had soared by 180% to 350% in these markets. And these bubbles have started to deflate. And the price drops have been spreading relentlessly and have been getting steeper.
In 30 bigger markets, prices of mid-tier condos through June have already dropped by 15% to 33% from their respective peaks. In 9 of them, prices have dropped by 21% to 33%. Most of their peaks occurred in the years between 2022 and 2024. These are starting to be substantial declines over a multiyear period. These 30 markets are depicted in the charts below.
In another 39 bigger cities prices, have dropped by 8% to 14%. They didn’t make the 15% cutoff to have their own chart. But they have their own table (see below the charts).
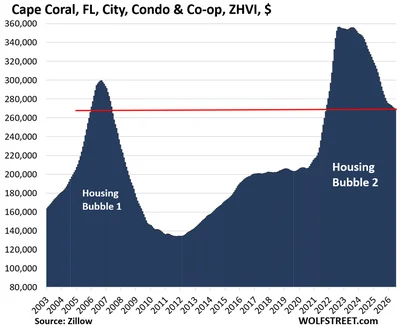
In several of these markets, condo prices have now dropped below their highs in 2006, below the peaks of Housing Bubble 1, and are back where they’d been 20 years ago. In a few other markets, prices have dropped close to their 2006 peaks. Those charts are marked with a red line.
There are also many smaller markets where condo prices have dropped just as much or more, but that are not included here because the markets are too small.
Most of the markets here are “cities.” But the list of 15% to 33% decliners also includes four counties where the cities – though household names – are too small to be included individually. And it includes one metropolitan statistical area, the Lakeland-Winter Haven MSA in Florida, for the same reason.
In some densely populated big cities, condos and co-ops make up a big part or the majority of home sales. In most other markets, condos are a relatively small portion of home sales.
Methodology and data: These prices here are seasonally adjusted three-month averages of “mid-tier” condos and co-ops from the Zillow Home Value Index (ZHVI), which is backward-looking index, based on millions of data points in Zillow’s “Database of All Homes,” including from public records (tax data), MLS, brokerages, local Realtor Associations, real-estate agents, and households across the US. It includes pricing data for off-market deals and for-sale-by-owner deals.
The Condo Bust by market in 30 charts.
The tables for each market below show from left to right: price decline from the peak, change from prior month (MoM), change year-over-year (YoY), and remaining increase since January 2000.
| | | | |
| --- | --- | --- | --- |
| Cape Coral-Fort Myers, FL, MSA, Condo Prices | | | |
| From July 2022 peak | MoM | YoY | Since 2000 |
| -33% | -0.4% | -12.1% | 128% |
Back to November 2005, that was 21 years ago. Two enormous speculative bubbles, two busts.
| | | | |
| --- | --- | --- | --- |
| Oakland, CA, City, Condo Home Prices | | | |
| From May 2022 peak | MoM | YoY | Since 2000 |
| -32% | -0.4% | -10.3% | 138% |
Prices are back to where they’d fist been 21 years ago, in mid-2005. Prices are down a lot, but are still very high after the huge surge in the years before mid-2022.
| | | | |
| --- | --- | --- | --- |
| St. Petersburg, Fl, City, Condo Prices | | | |
| From Oct 2022 peak | MoM | YoY | Since 2000 |
| -29% | -0.7% | -10.7% | 177% |
| | | | |
| --- | --- | --- | --- |
| Austin, TX, City, Condo Prices | | | |
| From Jul 2022 peak | MoM | YoY | Since 2000 |
| -28% | -0.8% | -6.0% | 103% |
| | | | |
| --- | --- | --- | --- |
| Fort Myers, FL, City, Condo Prices | | | |
| From July 2022 peak | MoM | YoY | Since 2000 |
| -27% | -0.4% | -11% | 119% |
Back to 2006.
| | | | |
| --- | --- | --- | --- |
| Sarasota County, FL, Condo \& Co-ops Prices | | | |
| From Jun 2022 peak | MoM | YoY | Since 2000 |
| -24% | -0.2% | -7.6% | 129% |
Back to 2006.
| | | | |
| --- | --- | --- | --- |
| Tampa, FL, City, Condo Prices | | | |
| From Sep 2022 peak | MoM | YoY | Since 2000 |
| -21% | -0.6% | -9.1% | 245% |
| | | | |
| --- | --- | --- | --- |
| Garland, TX, City, Condo Prices | | | |
| From July 2022 peak | MoM | YoY | Since 2000 |
| -21% | -0.8% | -12.4% | 204% |
| | | | |
| --- | --- | --- | --- |
| Jacksonville, FL, City, Condo Prices | | | |
| From Nov 2022 peak | MoM | YoY | Since 2000 |
| -21% | -0.7% | -7.9% | 140% |
| | | | |
| --- | --- | --- | --- |
| Detroit, MI, City, Condo Prices | | | |
| From Sep 2021 peak | MoM | YoY | Since 2000 |
| -19% | 0.2% | -7.0% | 244% |
| | | | |
| --- | --- | --- | --- |
| Denver, CO, City, Condo Prices | | | |
| From Jul 2022 peak | MoM | YoY | Since 2000 |
| -19% | -0.6% | -6.3% | 127% |
| | | | |
| --- | --- | --- | --- |
| Aurora, CO, City, Condo Prices | | | |
| From Jul 2022 peak | MoM | YoY | Since 2000 |
| -18% | -0.9% | -7.2% | 190% |
| | | | |
| --- | --- | --- | --- |
| Arlington, TX, City, Condo Prices | | | |
| From Jun 2024 peak | MoM | YoY | Since 2000 |
| -18% | -0.6% | -5.4% | 225% |
| | | | |
| --- | --- | --- | --- |
| Collier County (Naples), FL, Condo \& Co-ops Prices | | | |
| From Jun 2022 peak | MoM | YoY | Since 2000 |
| -18% | -0.5% | -6.1% | 152% |
| | | | |
| --- | --- | --- | --- |
| Orlando, FL, City, Condo Prices | | | |
| From Jan 2024 peak | MoM | YoY | Since 2000 |
| -17% | -0.7% | -8.3% | 146.7% |
Prices are back where they’d been at the peak of Housing Bubble 1 in the fall of 2006.
| | | | |
| --- | --- | --- | --- |
| Manhattan, NY, Condo \& Co-Op Prices | | | |
| From Jun 2022 peak | MoM | YoY | Since 2000 |
| -17% | -0.4% | 2.2% | 216% |
| | | | |
| --- | --- | --- | --- |
| Seattle, WA, City, Condo Prices | | | |
| From Jun 2022 peak | MoM | YoY | Since 2000 |
| -17% | -0.9% | -4.9% | 128% |
| | | | |
| --- | --- | --- | --- |
| Lakeland-Winter Haven, FL, MSA, Condo Prices | | | |
| From July 2022 peak | MoM | YoY | Since 2000 |
| -17% | -0.5% | -7.9% | 122% |
| | | | |
| --- | --- | --- | --- |
| Raleigh, NC, City, Condo Prices | | | |
| From July 2022 peak | MoM | YoY | Since 2000 |
| -17% | -0.5% | -8.3% | 131.4% |
| | | | |
| --- | --- | --- | --- |
| Hayward, CA, City, Condo Prices | | | |
| From July 2022 peak | MoM | YoY | Since 2000 |
| -17% | -0.7% | -8.4% | 174% |
Hayward, Oakland (see above, -32%), and Fremont (see below, -15%) are among a bunch of cities that make up the East Bay.
| | | | |
| --- | --- | --- | --- |
| San Mateo County, CA, Condo \& Co-op Prices | | | |
| From Jun 2022 peak | MoM | YoY | Since 2000 |
| -16% | -0.3% | -4.3% | 191% |
San Mateo County makes up northern Silicon Valley.
| | | | |
| --- | --- | --- | --- |
| Plano, TX, City, Condo Prices | | | |
| From Aug 2023 peak | MoM | YoY | Since 2000 |
| -16% | -1.0% | -8.6% | 122% |
| | | | |
| --- | --- | --- | --- |
| Port Saint Lucie, FL, City, Condo Prices | | | |
| From July 2022 peak | MoM | YoY | Since 2000 |
| -16% | -0.4% | -7.0% | 226.9% |
| | | | |
| --- | --- | --- | --- |
| Mesa, AZ, City, Condo Prices | | | |
| From Aug 2022 peak | MoM | YoY | Since 2000 |
| -16% | -0.7% | -4.7% | 196% |
| | | | |
| --- | --- | --- | --- |
| Fremont, CA, City, Condo Prices | | | |
| From May 2022 peak | MoM | YoY | Since 2000 |
| -15% | -1.0% | -6.8% | 195.1% |
| | | | |
| --- | --- | --- | --- |
| Portland, OR, City, Condo Prices | | | |
| From Jun 2022 peak | MoM | YoY | Since 2000 |
| -15% | -0.7% | -4.0% | 104% |
| | | | |
| --- | --- | --- | --- |
| Phoenix, AZ, City, Condo Prices | | | |
| From Aug 2022 peak | MoM | YoY | Since 2000 |
| -15% | -0.5% | -4.0% | 227% |
| | | | |
| --- | --- | --- | --- |
| Reno, NV, City, Condo Prices | | | |
| From Jun 2022 peak | MoM | YoY | Since 2000 |
| -15% | 0.0% | -3.5% | 241% |
| | | | |
| --- | --- | --- | --- |
| Chandler, AZ, City, Condo Prices | | | |
| From Aug 2022 peak | MoM | YoY | Since 2000 |
| -15% | -0.7% | -4.3% | 203.2% |
| | | | |
| --- | --- | --- | --- |
| Boise, ID, City, Condo Prices | | | |
| From Jun 2022 peak | MoM | YoY | Since 2001 |
| -15% | -0.4% | -1% | 221% |
Where condo prices fell less than 15%.
In many cities, condo prices have dropped by less than 15% or less, and they didn’t make the 15% cutoff for the table above and for the charts here.
Here is a sample list of 39 bigger cities where prices have dropped by 8% to 14% from their respective peaks. Several of them are only one or two bad months away from joining the above list, including one of the biggest cities in the country, Houston. Dallas isn’t far behind.
| | | | |
| --- | --- | --- | --- |
| Mid-tier condo prices fell by 8% to 14% | | | |
| | Market | Since peak | Year of peak |
| 1 | Houston, TX | -14% | 2024 |
| 2 | Queens, NY | -14% | 2022 |
| 3 | San Antonio, TX | -14% | 2024 |
| 4 | Tempe, AZ | -14% | 2022 |
| 5 | Glendale, AZ | -14% | 2022 |
| 6 | Huntsville, AL | -14% | 2022 |
| 7 | Dallas, TX | -14% | 2023 |
| 8 | Scottsdale, AZ | -14% | 2022 |
| 9 | Irving, TX | -13% | 2023 |
| 10 | Sacramento, CA | -13% | 2022 |
| 11 | Colorado Springs, CO | -13% | 2022 |
| 12 | Stockton, CA | -13% | 2022 |
| 13 | Corpus Christi, TX | -13% | 2023 |
| 14 | Fort Lauderdale, FL | -12% | 2022 |
| 15 | Modesto, CA | -12% | 2022 |
| 16 | Henderson, NV | -12% | 2022 |
| 17 | Las Vegas, NV | -12% | 2022 |
| 18 | Spokane, WA | -11% | 2022 |
| 19 | Nashville, TN | -10% | 2022 |
| 20 | Atlanta, GA | -10% | 2023 |
| 21 | Washington, DC | -10% | 2022 |
| 22 | Elk Grove, CA | -10% | 2022 |
| 23 | New Orleans | -10% | 2022 |
| 24 | Salt Lake City, UT | -9% | 2022 |
| 25 | San Francisco, CA | -9% | 2022 |
| 26 | Memphis, TN | -9% | 2024 |
| 27 | Fort Worth, TX | -9% | 2024 |
| 28 | San Diego, CA | -9% | 2023 |
| 29 | Los Angeles, CA | -8% | 2022 |
| 30 | Minneapolis, MN | -8% | 2021 |
| 31 | San Jose, CA | -8% | 2022 |
| 32 | Miami, FL | -8% | 2023 |
| 33 | Marietta GA | -8% | 2024 |
| 34 | Lubbock, TX | -8% | 2022 |
| 35 | Oklahoma City, OK | -8% | 2023 |
| 36 | Tucson, AZ | -8% | 2023 |
| 37 | Wilmington, NC | -8% | 2022 |
| 38 | St. Louis, MO | -8% | 2023 |
| 39 | Long Beach, CA | -8% | 2023 |
A reminder of the special issues condos face.
Condos play several roles, depending on the owner:
Some people buy condos as a home to live in an urban center or along the shore, to enjoy the big views, nice amenities, or central location. They value the worry-free living, such as not having to mess with maintenance, repairs, and yardwork; or having staff at a desk by the front door. Some value not having to climb stairs, etc.
Others buy condos as rental properties as a way to get into the multifamily rental business, or they try their hand at short-term vacation rentals. Or they buy them as vacation homes. Others, especially nonresident foreign investors, buy condos to park some cash in the US and watch the price spiral higher from a distance. It’s these investors and speculators that make condos particularly speculative and prices subject to huge bubbles and busts.
Some of the special issues:
- Over the long term, land appreciates, most buildings depreciate to zero and are eventually torn down. The land that big condo buildings sit on can be very valuable, but each condo owner only owns a tiny slice of it. The rest of their investment is in the building. A single-family house may sit on less valuable land, but the homeowner gets 100% of any appreciation of the land.
- Prices that exploded over the past few years ended up being way too high, once the mania settled down.
- Hefty special assessments – or the fear of them – for long-neglected major repairs dog some older condo buildings.
- Big increases in HOA fees at many properties, partly driven by spiking insurance costs in natural disaster zones, add substantially to the monthly costs of condos.
- If a condo building is on Fannie Mae’s Blacklist, financing a unit in that building gets very difficult, and sales may be limited to cash buyers who’ll exact their pound of flesh.
- The Free Money has ended, and mortgage rates are roughly back to a normal range. Buyers of single-family homes face the same issue.
- Foreign-based owners who’ve had it with the US and want to sell. And there are fewer foreign-based buyers.
- Investors in condos as rental properties are facing stiff competition from a wave of newly completed higher-end apartment buildings that developers are trying to find tenants for.
And in case you missed it:Pending Home Sales Plunge to Near-Record Low in the Data, Hit Low in the West. Since then, Mortgage Rates Rose Further
Enjoy reading WOLF STREET and want to support it? You can donate. I appreciate it immensely. Click on the mug to find out how: