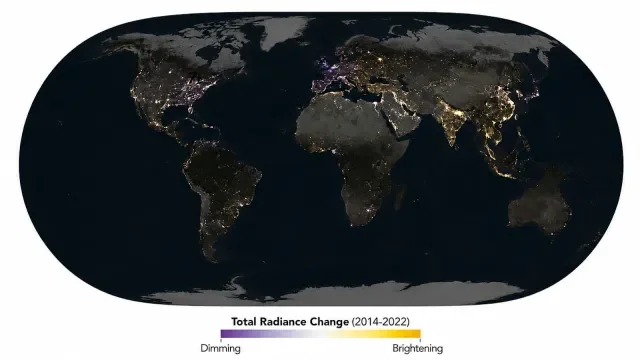
Don’t believe the Kremlin. It claims that from 2020 to 2024, the Russian economy grew by 13%. Instead, believe the lights Russians leave on at night. They reveal the country’s GDP actually shrank by 8% over that period. So says Sweden’s foreign minister Maria Malmer Stenergard in a New York Times op-ed. Stenergard wasn’t entirely guessing. Sweden’s intelligence services arrived at that figure by measuring nighttime luminosity, an increasingly mature and rigorous branch of economic geography. Because unlike the Kremlin, night lights don’t lie. Artificial light at night (ALAN) provides strangely honest data on GDP, poverty, war, and many other things governments would rather scientists didn’t measure. Recent analyses of NASA satellite data have made the field even more relevant, revealing the night side of the planet to be a subtle fact-checker of misinformation. An accidental science born in the Cold War Like many useful things, ALAN began as an accident — specifically, a Cold War one. In the 1960s, the U.S. Air Force launched a constellation of weather satellites under the Defense Meteorological Satellite Program. The satellites were designed to track cloud cover so military planners could decide where to fly bombers and surveillance aircraft. By happy coincidence, the same sensors built to watch clouds also picked up everything else glowing in the dark: gas flares, wildfires, city lights. The entire nocturnal fingerprint of human activity. Moscow’s Red Square at night. Changes in nighttime luminosity show Russia’s economy shrank by 9% from 2020 to 2024 instead of growing by 13%, as claimed by the Kremlin (to the left on this photo). (Credit: Soeren Stache/picture alliance via Getty Images) DMSP remained classified until the 1970s, when its data was made available to the civilian and scientific communities. After the fall of Communism, nighttime luminosity joined GPS on the list of military satellite secrets that became everyday tools. In the mid-1990s, operation of the satellites was transferred to the National Oceanic and Atmospheric Administration (NOAA). Around the same time, a NOAA researcher named Christopher Elvidge had a — pardon the phrase — lightbulb moment. He noticed that the combined wattage visible in DMSP imagery tracked with a country’s GDP astonishingly well. His logic is refreshingly simple: Economic activity needs energy, and a meaningful share of that energy escapes upward as light. Factories run night shifts, offices stay lit, ports glow around the clock. Each country is unknowingly broadcasting its economic report card straight into low-Earth orbit. A follow-up paper by Elvidge et al. found a correlation (R2) of 0.97 between lit areas and GDP across 21 countries. For the non-statisticians among us, that is the kind of near-perfect fit that makes most social scientists want to eat their 70-part questionnaires — along with the clipboard. Yet, much like the laser, which was dismissed when it was invented in 1960 as “a solution looking for a problem,” nobody knew quite what to do with this data. For nearly two decades, the correspondence between night lights and economic activity just sat there, lost aimlessly in the dark. From party trick to forecasting instrument The lights came on in 2012, when economists J. Vernon Henderson, Adam Storeygard, and David Weil published “Measuring Economic Growth from Outer Space” in the American Economic Review. This paper turned Elvidge’s neat party trick into a genuine forecasting and auditing tool. This comparison of satellite images from 2012 and 2021 show a major increase in nighttime luminosity across India, especially in the country’s northern belt, roughly from Delhi to Kolkata. (Credit: Reddit/MapPorn) The timing helped: That same year, NASA’s Visible Infrared Imaging Radiometer Suite (VIIRS) replaced the old DMSP satellite sensors with roughly 20 times the resolution, each pixel shrinking from 5 kilometers to 750 meters. With a wink to its famous 1972 “Blue Marble” photo of Earth, NASA packaged the new nighttime imagery in a product called “Black Marble.” Just like that, a new scientific discipline was born: nighttime light remote sensing (NTL). Turning nighttime glow into an actual GDP estimate takes a five-step dance with data: Acquire it. Thank you, VIIRS. Clean it up. Strip out the noise, such as moonlight, cloud cover, wildfires, and the aurora. Basically, anything that glows but doesn’t pay taxes. Measure radiance. Expressed in nanowatts per steradian per square centimeter, a unit that gives you the brightness of any patch of Earth you like. It can be a single VIIRS pixel, a city block, or an entire country. Apply elasticity. Henderson, Storeygard, and Weil found that a 1% change in luminosity corresponded to a 0.3% change in GDP (in countries with solid statistics, anyway). In emerging economies with shakier official numbers, that figure climbs to roughly 0.65%. Cross-reference and judge. Compare the satellite’s verdict with whatever official figures exist. In 2022, the World Bank indeed found that a 10% luminosity decline in emerging markets lines up with a GDP contraction of about 6.5%. Where the numbers don’t line up, you’ve either found a calculation error or a government that’s been doing some creative accounting. The field’s Hall of Fame (and Shame) North Korea is NTL’s reluctant poster child. The field’s single-most reproduced image is of the Korean peninsula after dark. South Korea blazes like its own private galaxy, centered on Seoul. Meanwhile, North Korea is almost entirely dark, with one single, defiant pinprick of light in Pyongyang — as if Kim Jong Un insists on sleeping with the hallway lights on. Nighttime image of the Korean Peninsula, captured by DMSP on September 21, 2003, with political borders overlaid on the raw satellite data. The image gained widespread recognition when it was used in a U.S. Department of Defense news briefing in 2006, following North Korea’s first underground nuclear test. (Credit: U.S. Department of Defense – public domain). Myanmar delivered the field’s first genuinely quantifiable gotcha. World Bank data showed the country growing at a blistering 10% a year between 1992 and 2006. Satellite imagery told a different story: close to zero growth, with the economy outright shrinking some years. The military junta had simply cooked the books, and nobody outside the country had any way to check until someone thought to ask the night sky. China is perhaps the emerging field’s most contested case. Economists at the St. Louis Fed found China’s cumulative GDP growth of roughly 122% between 1992 and 2006 stacked up against a luminosity-implied figure of 57% — a 65-percentage-point overstatement with economic and potentially geopolitical consequences. A landmark 2018 study by Luis Martinez, a professor of policy at the University of Chicago, found that in democracies, a 10% rise in nighttime light tracks a 2.4% rise in reported GDP — almost exactly what you’d expect. This means democratic books are roughly telling the truth. Conversely, in autocracies, the same 10% light increase comes with a much bigger reported GDP bump. Headline finding: Autocracies pad their GDP figures by 15 to 30% relative to what their light emissions support. That estimate tracks the 21-point gap in Sweden’s read on Russia, by the way. In 2016, when Indian Prime Minister Modi yanked 86% of the country’s cash out of circulation overnight, rural nighttime light dimmed sharply. Cash-dependent regions were hit hardest, even as official GDP figures showed an implausibly gentle slowdown. Venezuela offers one of the starkest recent examples of economic collapse. VIIRS data shows luminosity down 30–50% across large parts of the country, broadly matching an independently estimated 75% GDP collapse between 2013 and 2021. The Black Marble, simultaneously brightening and dimming NTL keeps getting more interesting. A 2026 analysis of NASA’s Black Marble data, which landed on the cover of Nature, found that global nighttime radiance rose 34% between 2014 and 2022. However, that tidy headline number hid a planet brightening and dimming at the same time, a phenomenon researchers call “bidirectional change.” While the West Coast metros got uniformly brighter, the night lights in large parts of the eastern half of the U.S. dimmed considerably. (Credit: NASA Earth Observatory/Michala Garrison) The U.S. provides a textbook example: West Coast metros grew brighter as their populations swelled, while much of the East Coast dimmed — not from decline exactly, but from efficient LED retrofits and the slow-motion restructuring of older industrial corridors. Internationally, China and northern India blazed brighter with breakneck urbanization, while Paris, London, and the Netherlands dimmed by 20–33%, mostly courtesy of LED swaps and tighter light-pollution rules. And in early 2022, Europe’s lights dimmed sharply for an altogether less positive reason: The energy crisis triggered by Russia’s invasion of Ukraine. Per Sweden’s accounting, the same war quietly dimmed Russia’s own economy on the other side of the frontline. More than a GDP gadget Previously, we would have intuitively guessed that the Earth’s artificial lights keep getting brighter. The realization that they are simultaneously brightening and dimming adds a subtle layer to NTL and suggests it can do more than just read economic data. Such as: Mapping poverty. Luminosity tracks household wealth closely enough to produce poverty maps down to individual city districts. Think census work without the inconvenience of field surveys. Monitoring urbanization. Official city boundaries rarely keep pace with fast-growing informal settlements. NTL tracks the real footprint regardless of what the municipal map says. Tracking electricity access. Another reliable way to annoy a government. A University of Michigan study discovered that Indian villages officially declared “electrified” sometimes had exactly one streetlight hooked up. Charting wars. Researchers at Wuhan University found that 83% of Syria’s lights had gone out between the start of its civil war in 2011 and 2015. It is one of the largest luminosity collapses ever recorded. In Aleppo, the hardest-hit city, the figure reached 97%. The data showed a near-linear relationship between a province’s light loss and the number of people who fled it, turning satellite photography into an improvised refugee census. Spotting dark fleets. A Science Advances study exposed more than 900 Chinese vessels illegally fishing in North Korean waters at night. The fishermen were using floodlights to lure squid to their nets. Disaster response. After Hurricane Maria knocked out Puerto Rico’s grid in 2017, VIIRS imagery showed the entire island going dark in near real time, a stark visualization of the damage that beat official reports by weeks. Regional favoritism. In a paper that surely belongs in this field’s Hall of Fame, economists Roland Hodler and Paul A. Raschky found that in many countries, a sitting national leader’s home region systematically emits more light — a proxy for public investment — than comparable regions elsewhere in the same country. The list keeps growing: cross-checking carbon emissions, verifying whether foreign aid actually reaches the ground, and so on. But none of it works with satellite data only, and none of it is infallible. NTL is an extraordinarily good lie detector. Like any lie detector, it still needs a competent examiner asking the right follow-up questions. If you don’t know anyone, we’re sure the Swedish foreign minister can hook you up. Western Europe stands out on this image of the world’s eastern hemisphere as the only major region where nighttime lights have consistently dimmed from 2014 to 2022. (Credit: NASA Earth Observatory/Michala Garrison) Strange Maps #12xx Got a strange map? Let me know at strangemaps@gmail.com. Follow Strange Maps on X and Facebook. This article How Earth’s night lights became our most honest economist is featured on Big Think.
How Earth’s night lights became our most honest economist