Looking at them in the context of the rest of the labor market.
By Wolf Richter for WOLF STREET.
These three categories of workers can shed some light on the complexities of the labor market, against the background of the employment report today by the Bureau of Labor Statistics (discussion here).
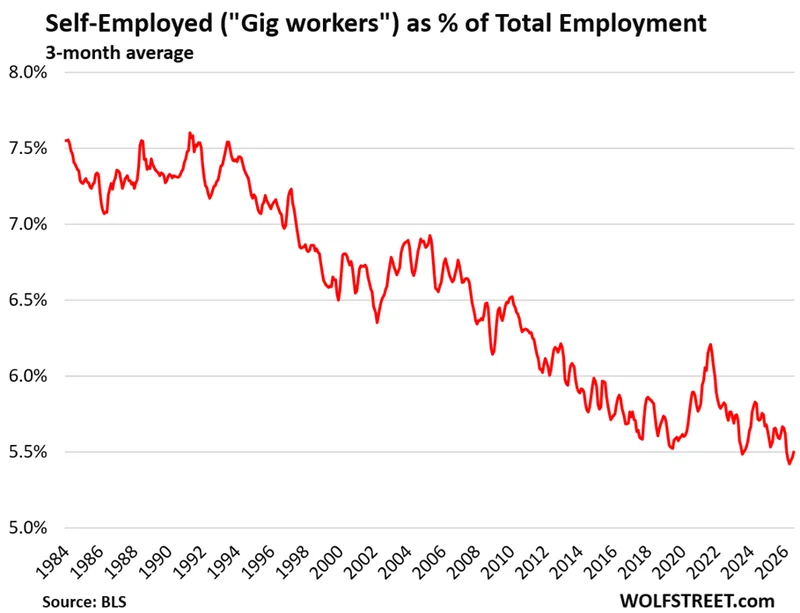
Self-employment is at a historically low share of total employment. The number of self-employed non-agricultural and non-incorporated workers – including the “gig workers” – ticked up to 9.07 million in July, accounting for 5.6% of total employment, a historically low share (charts below show the three-month averages, which iron out some of the monthly squiggles).
The self-employed range from professionals that have struck out on their own to be their own boss to rideshare drivers.
Part-time employment is defined as working up to 34 hours per week. So the upper end of part time is not far from full time (35 hours or more).
There were 28.76 million people who were working part time, accounting for 17.7% of total employment.
Part-time workers are divided into two categories:
For “noneconomic reasons.” Part-time work is what suits their needs, such as childcare problems, family or personal obligations, school or training, staying connected in retirement, Social Security limits on earnings, and other reasons.
There were 22.8 million people in July who were working part-time for these noneconomic reasons. This figure doesn’t really say anything about labor market conditions.
For “economic reasons.” They want to work more hours but cannot find a full-time job, or the hours of their full-time job got cut to 34 hours or less.
Part-time employment due to economic reason is caused by labor market conditions and sheds some additional light on those conditions. And we need to keep our eyes on it.
The number of people who worked part-time due to economic reasons rose to 4.8 million in July, accounting for 3.0% of total employment.
This share of 3.0% is historically low. But there were periods when it was lower: during the Dotcom Bubble; briefly in 2006; from mid-2019 to January 2020; and then since the labor shortages starting in late 2021, except for a couple of months late last year.
In a hot labor market, we would expect this share to decline to the 2.5% range, where it had been in the prior hot labor markets (Dotcom Bubble of the late 1990s and the period of labor shortages in 2021-2022)
Multiple jobholders are defined as holding two or more jobs during the survey reference week, at least one of which must be a wage and salary job. This includes “unpaid family workers” (work without pay on the family farm or business = one job) who also have a wage and salary job.
Multiple jobholders encompass diverse situations. For example, about 15 million single-family rental properties are owned by mom-and-pop landlords (1-10 properties). Those among the millions of owners that manage their own rentals and in addition have a wage and salary job count as multiple jobholders. A guy working for a tech company on a salary and stock options, plus working part-time as a consultant or coder is a multiple jobholder. The teacher who also drives for Uber is one too. A person with a salaried engineering job who also works unpaid at a family business or farm is a multiple job holder. A grocery store cashier who waits tables in the evening is also one of them.
Multiple jobholders are not automatically a sign of economic distress or low-paid jobs or not being able to make ends meet or whatever – though some multiple jobholders fall into these categories. Broadly, multiple jobholder data illuminate the dynamic complexity of people’s lives and interests, the American spirit of working, and people’s ability to create multiple income streams.
There were 8.58 million multiple jobholders in July, not seasonally adjusted, accounting for 5.3% of total employment.
The range of those months is the lowest since late 2024 and right in the middle of this 40-year historic range.
Of those multiple jobholders:
- Over half (55%) had a full-time job and a part-time job
- A quarter (25%) had two part-time jobs and no full-time job.
- Only 5.5% had two full-time jobs.
- And 13% had varying hours in either job.
Enjoy reading WOLF STREET and want to support it? You can donate. I appreciate it immensely. Click on the mug to find out how: