How Americans are handling their debts.
By Wolf Richter for WOLF STREET.
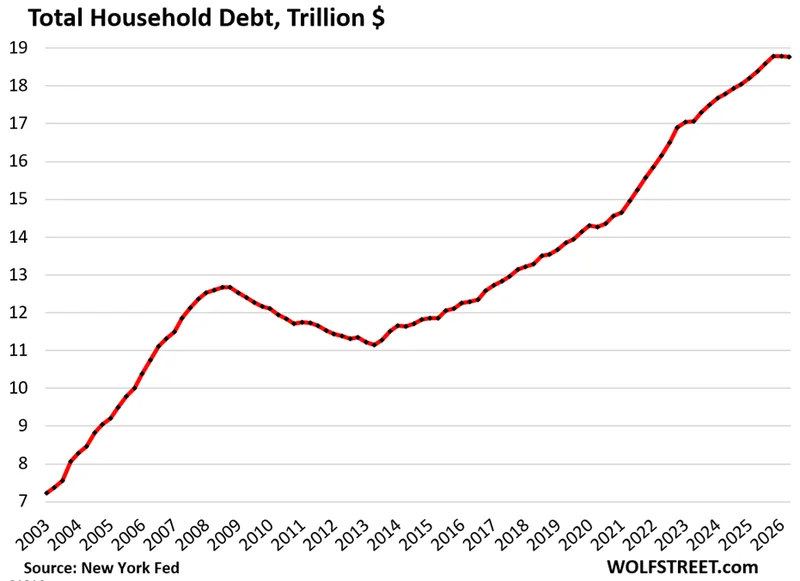
Total household debt outstanding in Q2 – mortgages, HELOCs, student loans, auto loans, credit card balances, and other consumer loans such as personal loans and BNPL loans – dipped by $23 billion, or by 0.1% from Q1, to $18.77 trillion, after having been nearly unchanged in Q1, according to the Household Debt and Credit Report from the New York Fed today, which obtained this data via its partnership with Equifax.
The decline in Q2 was driven by mortgage balances, which fell by $74 billion due to temporary technical reporting issues, according to the New York Fed. But HELOC balances jumped from the prior quarter, auto loan balances rose, credit card balances inched up, and student loan balances dipped.
Year-over-year, household debt rose by $383 billion, or by 2.1%, the smallest year-over-year percentage increase since 2015.
The burden of the debt.
The number of households has grown over the years, and in addition, the income per household has grown on average, and so total household income has grown faster than total household debt over the years, and the burden of this debt on household income has declined over the years, and it decline more sharply in Q2.
The debt-to-income ratio is a classic way of evaluating the burden of a debt. With households, we can use the debt-to-disposable-income ratio.
Disposable income (Bureau of Economic Analysis) consists of after-tax wages, plus income from interest, dividends, rentals, farm income, small business income, transfer payments from the government, etc.
But it excludes capital gains, which is where the wealthy make most of their money. Excluded are thereby income from stock-based compensation plans and capital appreciation where billionaires make their billions.
The debt-to-disposable income ratio in Q2 declined to 79.4%, as disposable income rose to a record while debt balances dipped.
This ratio was the lowest in the data going back to 2003, except for two quarters during the stimulus era, when disposable income was inflated beyond recognition by massive government handouts, including the stimulus checks, PPP loans, and numerous other programs.
Leading up to the Financial Crisis, households were highly leveraged, and when the debt-to-disposable-income ratio went over 110%, everything went to heck.
Now household balance sheets are in relatively good shape overall – unlike some other economic entities that are overleveraged and overindebted, such as the federal government, some corners of finance, and some entities in Corporate America.
That’s where the risks are this time around, not with households: 65% own their own homes, and home prices soared over the years through mid-2022. About 40% of them own their homes free and clear, while another big portion has only a relatively small balance left on their mortgages. Over 60% of households have at least some equities, and their prices have continued to soar. They hold precious metals and cryptos. And they’ve got $5.2 trillion stashed away in money market funds and are sitting on a pile of CDs.
Delinquency rates.
Starting in 2025, federal student loans that had been covered by the government’s forbearance policies since 2020 came out of forbearance. During the government’s forbearance program, borrowers didn’t need to make payments, and their loans weren’t counted as delinquent, and many borrowers didn’t even consider them “loans” anymore, but just something that would be a gift and forgiven.
That mostly ended in 2025, and those federal student loans suddenly showed up on credit reports again, but as delinquent, and student-loan delinquency rates exploded into the double digits. But over the past two quarters, fewer student loans transitioned into delinquency, though the percentage that have been delinquent since the change in 2025 remains huge. Student loan balances amount to $1.65 trillion, and so the impact of those delinquency rates is visible.
So how are households doing now.
30-59 days delinquent, red line in the chart below: The amount of household debt – mortgages, HELOCs, auto loans, credit cards, and student loans – that had turned 30 days delinquent by the end of Q2 but was less than 60 days delinquent ticked up to 1.05% of total household debt balances, according to the New York Fed’s Household Debt and Credit Report. This is at the low range before the pandemic.
The shift of student loans into this time frame in 2025 caused that rate to spike, but as fewer student loans became delinquent this year, and as delinquent student loans moved on to the 60-day and 90-day categories, and further out, the 30-59-day delinquency rate has settled back down this year.
60-89 days delinquent, blue line: These delinquent loans weren’t cured during the prior 30-59-day period and therefore moved into the 60-89-day category by the end of Q2. This generation of delinquent balances dipped to 0.4% of total debt balances.
90-119 days delinquent, double-green line: These delinquent loans have not been cured in the prior two periods and are still delinquent. That rate declined to 0.2%.
These three categories together, dotted yellow line, dipped to 1.7% of total household debt was between 30 days and 119 days delinquent at the end of Q2. And this speaks of a consumer that is in pretty good shape now.
There is a lot of older delinquent debt on credit reports, and that percentage has kept rising, causing a lot of consternation. But the New York Fed, in an interesting blogpost today, clarified this issue with regards to credit cards: These were “stale, charged-off debts” that for whatever reason haven’t been removed from reporting, when in previous years, these stale, charged-off debts would have been removed. It summarized:
“We find that the stock delinquency rate is rising because of a pool of stale, charged-off debts that lenders have been reporting for longer durations, rather than a fundamental worsening in the incidence of delinquency.”
By disaggregating the delinquency rates and focusing on the accounts that became delinquent over the prior 120 days, we can see how consumers are doing now, and it eliminates the issue of the “stale, charged-off debts” that are still being reported for whatever reasons, when they hadn’t been reported in prior years. It also shows to what extent consumers are curing delinquent debts, and how quickly they’re curing them.
These rates are held down by mortgage delinquencies, which are in very good shape. Mortgages make up 70% of total household debts. Delinquency rates are substantially higher for other loan types (we’ll get to each debt category over the next few days, so stay tuned).
New foreclosures on credit reports in the quarter edged down to 55,160. During the era of mortgage forbearance, foreclosures were essentially impossible and had dropped to near-zero.
Foreclosures have come up from the near-zero levels – in percentage terms, the increase from near-zero was huge and impressive and made great headlines – but throughout foreclosures have remained below the low end of the Good Times in 2018-2019, and far below the number of foreclosures in prior years.
Third-party collections continued to wobble along rock-bottom. The percentage of consumers with third-party collections on file within the past 12 months dipped to 4.9%.
Credit accounts, such as credit cards, make up only a small proportion of collection actions. The majority of collection actions derive from unpaid medical bills and utility bills, according to the New York Fed’s Data Dictionary. The data is based on public records and credit reports.
During the Great Recession and the unemployment crisis, households piled on a lot of unpaid bills that gradually made their way to third-party collection entries that then peaked at over 14% in 2013.
New bankruptcies also continued to wobble along rock-bottom. The number of consumers with new bankruptcy filings during the quarter edged up to 136,800 in Q2, far below the low end of the Good Times before the free-money pandemic.
I will discuss housing, auto, and credit card debt and delinquencies in three separate articles over the next few days. Next one up is housing debt.
Enjoy reading WOLF STREET and want to support it? You can donate. I appreciate it immensely. Click on the mug to find out how: