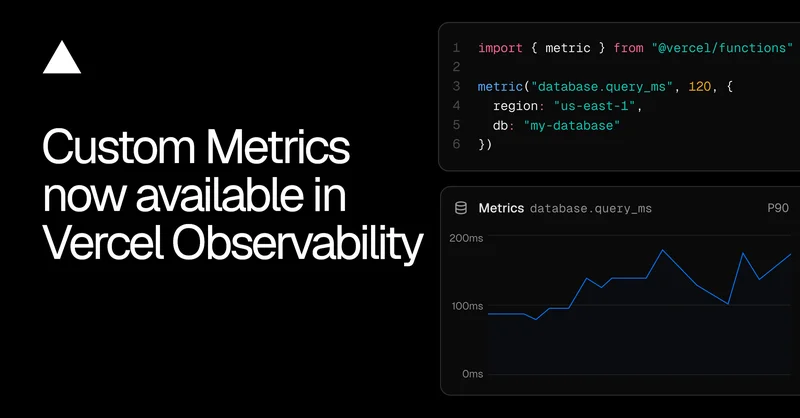
You can now emit your own metrics directly from your Vercel Functions and analyze them alongside Vercel's built-in observability data.
Use the metric() function from the @vercel/functions package to record any value you care about, like request latency or business events, and attach attributes to filter and group by:
import { metric } from "@vercel/functions";
metric("database.query_ms", 120, {  table: "my-table",  db: "my-database"});
Once emitted, your custom metrics are available across Observability:Query builder: slice and aggregate metrics on the fly.Notebooks: build and share dashboards.CLI: query using the vc metrics command.
Vercel automatically adds useful attributes like the source deployment and function region. Custom metrics are billed as observability events and available on Pro and Enterprise with Observability Plus.
Learn more in the docs.