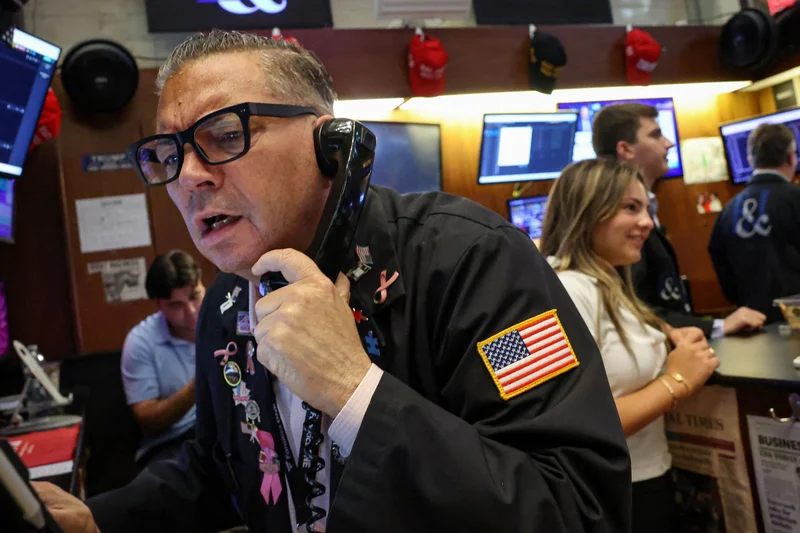
Activity at the index level in stocks belies chaotic dynamics taking place under the hood. The S & P 500 — despite persistent tensions between Iran and the U.S. and the recent struggles seen in semiconductor stocks — remains less than 3% below its record high set in June. Partly that's due to strong earnings, plus a belief that the U.S. doesn't want a prolonged war in the Middle East. Yet what's happening the under the surface could soon bubble up and put more pressure on the broader market. I looked at the S & P 500 components this morning and found the following: Through Monday's close, there are roughly 160 S & P 500 members trading below their 50-day moving averages. That level is used by traders and technicians to gauge an asset's short-term momentum. If price is below the 50-day, it tends to indicate a near term deterioration, with the potential for greater losses ahead. There are also 197 index constituents that are down for the month. Of those, 43 have fallen 10% or more in July. Lastly, more than half of the S & P 500 has seen its relative strength index decline over the past month. Specifically, RSI has dropped in that time for 264 stocks in the S & P 500. There is a "growing divergence between muted index-level volatility and elevated single-stock volatility," wrote Alex Sagal, global equity analyst at Wells Fargo Investment Institute. This comes as traders await earnings from four megacap companies. Microsoft , Apple , Amazon and Meta Platforms are due to post results this week. So far, earnings have been better than expected. Roughly one-third of the S & P 500 has posted bottom-line results. Of those, 83% have exceeded analyst expectations, FactSet data shows. Tesla and Alphabet , however, were two high-profile misses that weighed on the market last week. "As earnings season progresses, sustained stock-specific volatility could begin to translate into greater index-level volatility," Sagal said.
Volatility in single stocks is rising. It could soon threaten the S&P 500 too