The US added 1.51 million housing units (new construction minus demolitions) in 12 months, homes for 3.5 million people. The population grew by 757,000. And vacant housing units continued to surge.
By Wolf Richter for WOLF STREET.
The US added 1.51 million housing units (new construction minus demolitions) in 12 months, homes for 3.5 million people. The population grew by 757,000. And vacant housing units continued to surge.
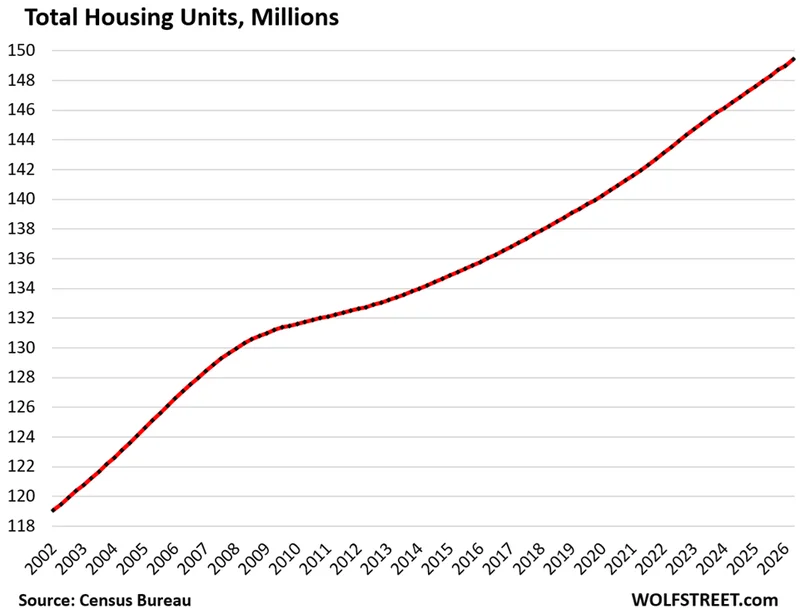
The total US housing stock grew by 1.507 million housing units (new construction minus demolitions) over the past 12 months through Q2, to a total of 149.45 million housing units, according to the Census Bureau today. These are single-family homes, townhomes, duplexes, ADUs, etc., and multifamily homes such as condos and apartments.
With an average household size in the US of 2.3 people per housing unit, this addition of 1.507 million housing units over the 12 months provided homes for an additional 3.47 million people.
But population growth has faded amid a crackdown on illegal immigration. For the 12-month period through July 2026, the US population is estimated to increase by only 757,000 people, according to separate data from the Census Bureau earlier this year.
Over the past five years, the total US housing stock grew by 7.51 million housing units (new construction minus demolitions). At the average household size, this addition provides housing for 17.3 million more people.
But over the five-year period through July 2026, the US population is estimated to have grown by 10.4 million people, including the two-decade-record surge in 2023 and 2024 (my analysis).
In other words, over this five-year period, the housing stock has grown substantially faster than the population, and this is showing up in the data on vacant housing units.
The vacant housing stock.
There were 15.64 million vacant housing units in Q2. Of them, 12.22 million were “year-round vacant,” or 8.2% of the total housing stock. And 3.44 million were “seasonal vacant.”
“Year-round vacant” does not mean that they were vacant for an entire year, but are intended for occupancy at any time of the year, as opposed to housing units that are intended for seasonal occupancy (“seasonal vacant”).
Year-round vacant are classified in these categories:
- Vacant for rent
- Vacant for sale
- Rented or sold but new tenants/owners not moved in
- Held off the market:
- For occasional use
- Temporarily occupied by persons with usual residence elsewhere
- Vacant for other reasons
Vacant, on the market for sale or for rent rose year-over-year by 5.5%, or by 249,000 housing units, to 4.75 million vacant units for sale and for rent, the highest since Q3 2017.
Over the past five years, vacant-year-round units for rent and for sale surged by 1.10 million units.
There are some documented shifts from for-sale inventory that doesn’t sell and then gets put on the rental market, which shifts the number of vacant units for sale to the category of vacant units for rent. And we can see some of the shifts in a moment.
If the owners actually succeed in renting out the unit, they became what the industry calls “accidental landlords,” and their units shift from the vacant housing units list to the occupied housing units list.
Year-round vacant units also get pulled off the market and are held off the market for variety of reasons, which shifts housing units into the category of “Held off the market.”
Vacant on the market for rent – including by “accidental landlords” that tried to sell their home – rose year-over-year by 181,000, or by 5.1%, to 3.73 million, the most since 2013.
Over the past five years, year-round vacant units for-rent rose by 807,000.
Vacant on the market for sale jumped year-over-year by 7.2% or by 68,000 to 1.02 million units that are vacant and for sale.
Note: This does not include homes that are for sale but occupied. Those units are on the “occupied housing units” list.
None of these data are seasonally adjusted, so we see some seasonality in the for-sale units.
Over the five-year period, vacant for-sale units surged by 41%, or by 297,000.
And remember:
- A portion of the overall for-sale units are “occupied” and are not included on this “vacant year-round” list but on the “occupied” list. These are just vacant for sale units.
- A portion of what used to be vacant for-sale housing units are now vacant for-rent units, as these “accidental landlords” shifted their properties into the chart above of vacant for-rent units.
Vacant but rented or sold and not yet occupied rose 5.8% year-over-year to 1.00 million housing units. Over the past five years, the number fell by 10%.
Vacant and held off the market: Of those 12.22 million year-round vacant housing units, 6.55 million year-round vacant housing units were held off the market for a variety of reasons, a portion of which constitutes the vacant shadow-inventory that will show up on the for-sale or for-rent market at some point – and some of it has already shown up.
Included in this count of “held off the market” vacant housing units are those held for occasional use, those temporarily occupied by persons with usual residence elsewhere, and vacant for other reasons (such as for settlement of an estate or held off the market for personal reasons of the owner).
As the number of housing units that were vacant for-sale and vacant for-rent surged over the past five years, the count of year-round vacant “held off the market” units has shrunk. In other words, part of this shadow inventory became actual for-sale or for-rent inventory over the years and shifted into those two categories.
Some related points based on separate data that boil down to this: Bring on the new construction:
In the South, inventory for sale of new single-family homes was up 71% from 2019, while sales were down 8%. In the West, inventory of new single-family homes was up by 22% from 2019 and sales were down by 50%. Homebuilders are very motivated to make deals. Read: New Single-Family Home Prices Drop Further amid once again Growing Inventory Glut and Declining Sales.
And on the rental market, the gap between single-family rents and multifamily rents has widened massively. A look at 14 big markets. Read: Single-Family & Multifamily Rents in Face of an Onslaught of New Supply & Fading Population Growth.
Enjoy reading WOLF STREET and want to support it? You can donate. I appreciate it immensely. Click on the mug to find out how: