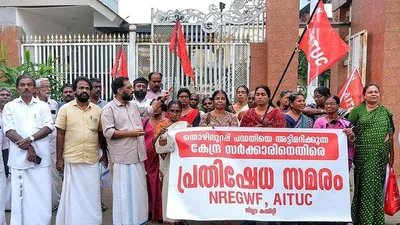
The National Rural Employment Guarantee Workers Federation, affiliated to the All India Trade Union Congress, stages a protest in Thrissur against the VB-G RAM G Bill.
\| Photo Credit: K.K. NAJEEB K.K. NAJEEB
Government expenditure on welfare schemes, or social spending, remains intensely debated. While some critics call it a fiscal ‘burden’, others call it a fiscal ‘commitment’. In line with the constitutional imagination, several welfare schemes were turned into laws in the 2000s, creating a ‘rights-based’ welfare regime. Over the last decade, however, the emphasis has shifted away from rights towards cash transfers. A recent handbook of welfare in India called Realising Rightsby the Centre for the Study of the Indian Economy, Azim Premji University, traces the history and budgetary implications of key central welfare programmes.
Chart 1 shows Union and State government allocations for welfare schemes in the financial year 2025-26. Union allocations are drawn from the Expenditure Budget 2025-26, except for the Maternity Entitlements scheme (PMMVY), which is taken from the Parliamentary Standing Committee Report No. 377. State-level allocations across schemes are not available in one source; the 2025-26 figures have therefore been collated from multiple sources.
Chart appears incomplete? Click to remove AMP mode
For ease of presentation, social justice and empowerment, tribal affairs and minority affairs are grouped together, as are Integrated Child Development Services (ICDS), the PMMVY and the Public Distribution System (PDS). State allocations for social justice and tribal affairs are drawn from the RBI database, while those for minority affairs are unavailable and therefore excluded. The PMMVY and the ICDS are centrally sponsored schemes, with the Centre bearing 60% of the cost and States 40%. The Mahatma Gandhi National Rural Employment Guarantee Act (MGNREGA) was funded in a 90:10 ratio; its replacement with the VB-GRAM G Act will add much more to States’ contribution.
States’ share of school education spending is estimated at 75.2% using the latest Analysis of Budgeted Expenditure on Education. Health expenditure is based on Statement 37 of RBI State Finances, while State food subsidy spending is drawn from the 16th Finance Commission reports.
Click to subscribe to our Data newsletter
Table 1 shows Union spending on PM Kisan, the National Social Assistance Programme (NSAP), Finance Commission grants to local bodies, and State spending on cash transfers. According to the 16th Finance Commission Report, States spent ₹4.14 lakh crore on unconditional cash transfers.
Table 2 summarises total Union and State expenditure on the schemes and sectors covered in Chart 1 and Table 1. Combined allocations for these selected welfare schemes in 2025-26 amounted to ₹24.20 lakh crore, or 6.77% of GDP, with the Union government’s contribution accounting for just 1.89% of GDP. While real expenditure on social services has increased over time, the Union government’s share has remained largely stagnant (Chart 2), with the overall rise driven by States. Although India’s tax to GDP ratio is comparable to middle-income countries, it lags behind on social security as a share of its GDP.
While tax revenues favour the Union government, the onus of funding falls disproportionately on States who already face budget constraints. Putting forth a strong macroeconomic case for increased social sector spending, a recent paper in the Economic and Political Weeklyby Bose and Banerjee argues that human development and growth are a ‘mutually reinforcing cycle of causation with success in one tending to promote success in the other’. The Union government must increase its fiscal commitment to the social sector to ensure that the welfare regime aligns with constitutional precepts.
Also read: VB-G RAM G vs MGNREGA: States’ expenditure could go up six-fold from ₹7,600 cr to ₹51,000 cr
Published - July 21, 2026 08:00 am IST